Please note that these factsheets are for the 2017 report card. The 2018 Regional Factsheets are accessible here.
Looking for easily-accessible facts specific to your region to present and share with your communities? We have pulled data from our 2017 Child Poverty Report Card to create Regional Factsheets that are shareable in .pdf and .ppt files and can be downloaded below. Special thanks to Laure Spake for her work in the early stages of this project.
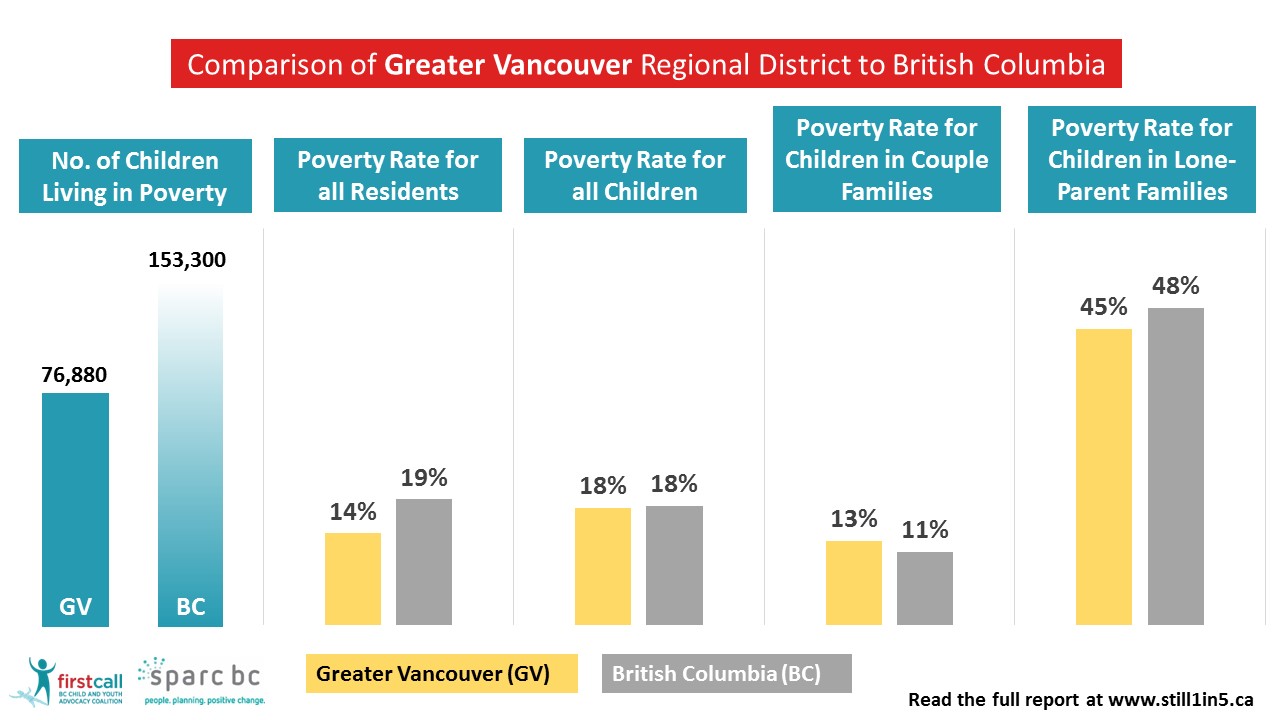
Page One of the Factsheet includes graphics to illustrate the regional data for:
- How many children are living in poverty
- Poverty rate for residents of all ages
- Poverty rate for all children
- Poverty rate for children in couple families
- Poverty rate for children in lone-parent families

Page Two includes graphs comparing the data from your region to British Columbia-wide data.

We invite you to download and share the Factsheets as needed. Please contact us with any questions.
Alberni-Clayoquot | PDF | PowerPoint
Bulkley-Nechado | PDF | PowerPoint
Capital | PDF | PowerPoint
Cariboo | PDF | PowerPoint
Central Coast | PDF | PowerPoint
Central Kootenay | PDF | PowerPoint
Central Okanagan | PDF | PowerPoint
Columbia-Shuswap | PDF | PowerPoint
Como-Valley | PDF | PowerPoint
Cowichan Valley | PDF | PowerPoint
East Kootenay | PDF | PowerPoint
Fraser Valley | PDF | PowerPoint
Fraser-Fort George | PDF | PowerPoint
Greater Vancouver | PDF | PowerPoint
Kitimat-Stikine | PDF | PowerPoint
Kootenay Boundary | PDF | PowerPoint
Mount Waddington | PDF | PowerPoint
Nanaimo | PDF | PowerPoint
North Okanagan | PDF | PowerPoint
Northern Rockies | PDF | PowerPoint
Okanagan-Similkameen | PDF | PowerPoint
Peace River | PDF | PowerPoint
Powell River | PDF | PowerPoint
Skeena-Queen Charlotte | PDF | PowerPoint
Squamish-Lillooet | PDF | PowerPoint
Stikine | PDF | PowerPoint
Strathcona | PDF | PowerPoint
Sunshine Coast | PDF | PowerPoint
Thompson-Nicola | PDF | PowerPoint